
From 2015-2021, I lead design at Fortune 200 Energy EOG, generating est. $17M+ capital efficiency with a suite of 17 Apple iOS applications
My role as the lead Native iOS designer bridged the innovation gap by instituting pattern standards, and earning CTO trust to deliver design at scale. Over six year span with 3 Apple iOS designers, we developed enterprse-level design system, tooling, and workflow processes.
Our tools served three cohorts:
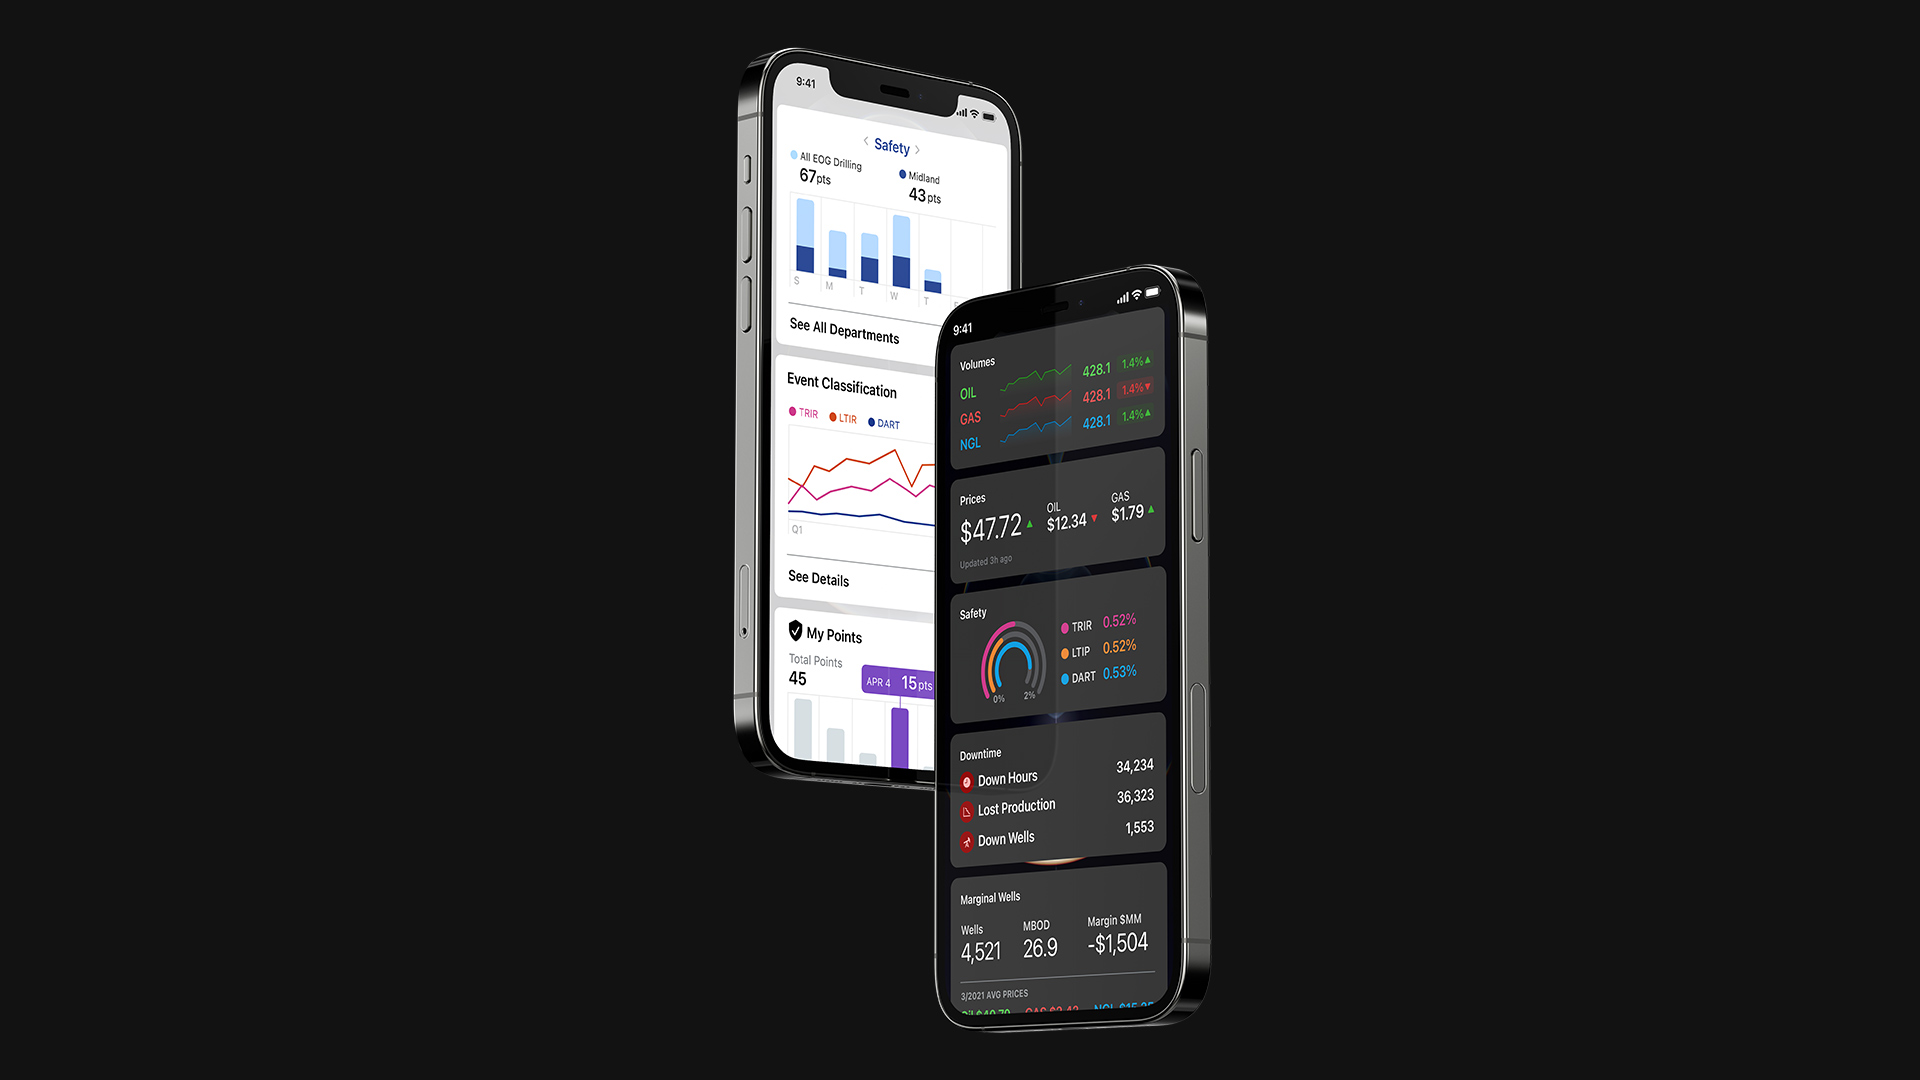
C Level Leadership
Operational Dashboards / Data Visualization
Sustainability CO2 Energy Dashboard
Financial Forecasting vs. Actual Tools
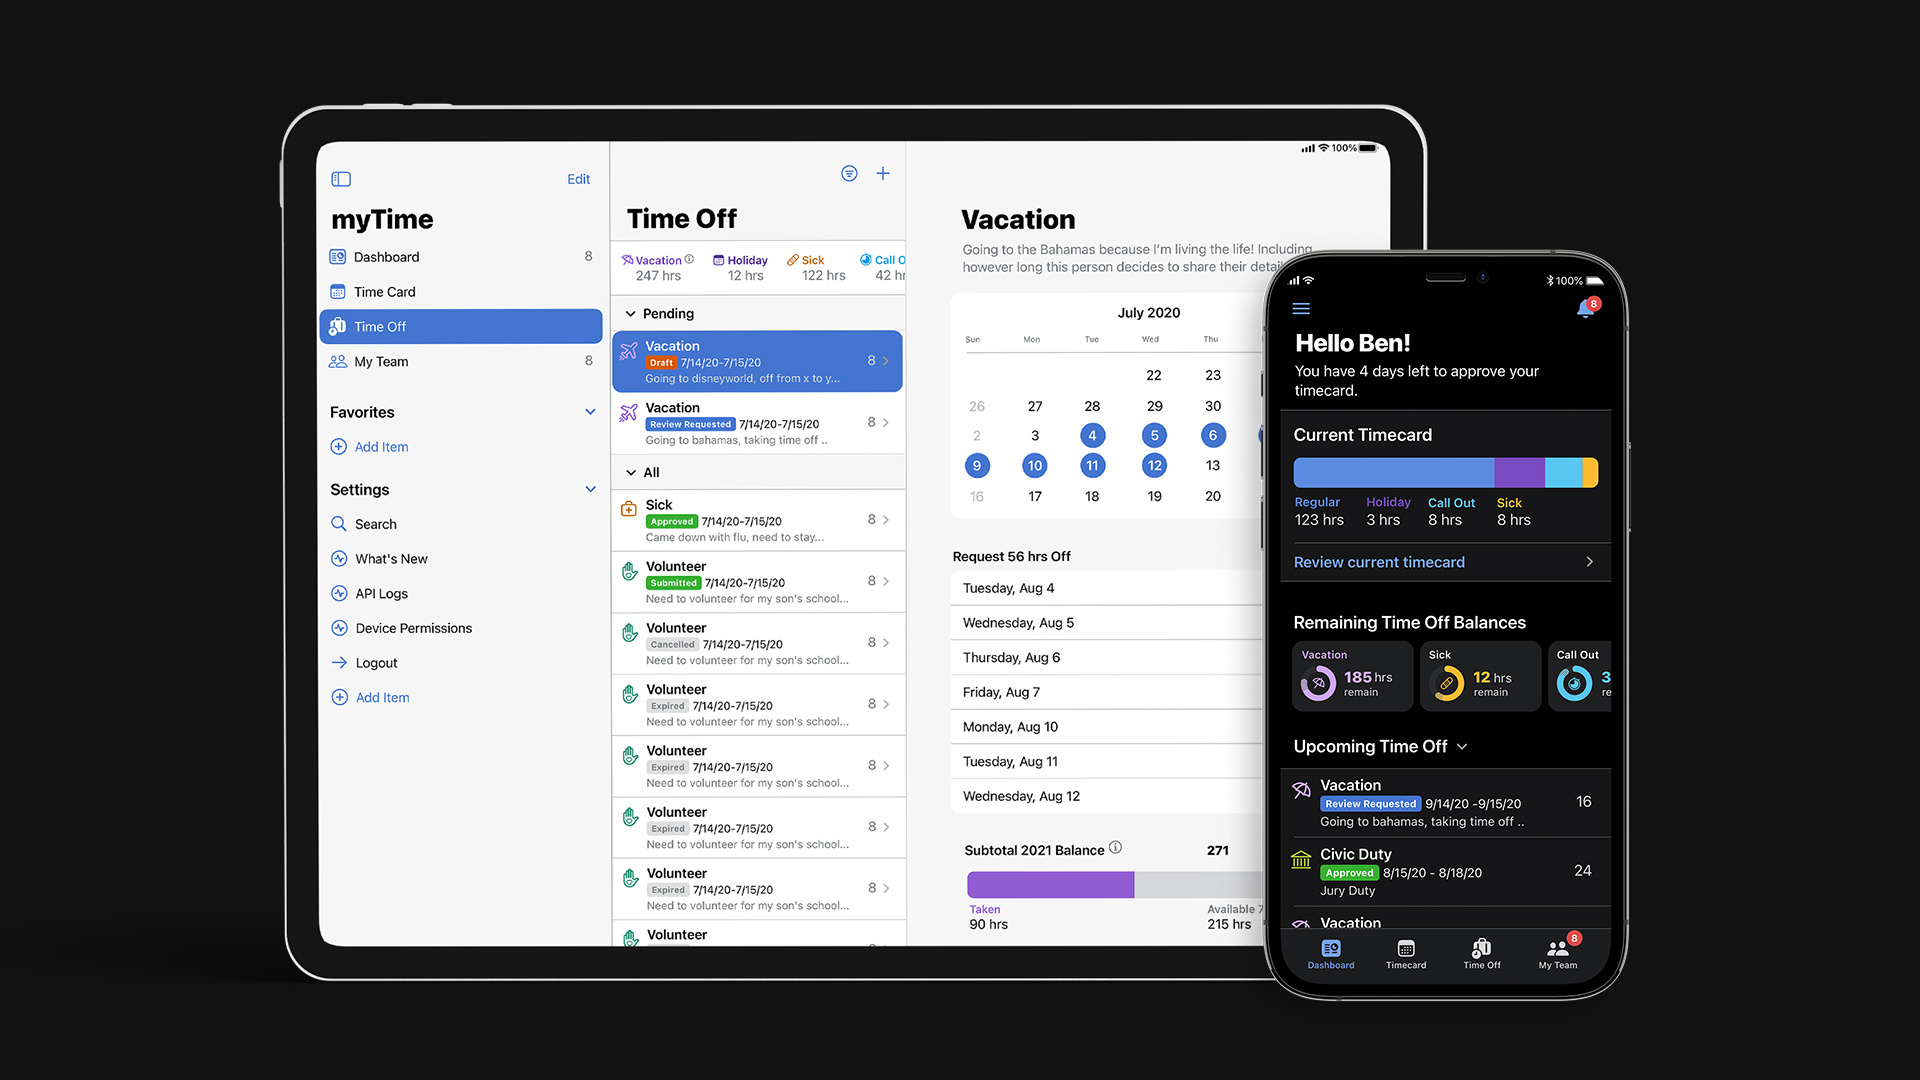
People, Business, Science Management
People Management : Payroll & HR
Return to office, COVID Contact Tracing
File, and Drive Exchange Management
Driving Navigation & Hazard Reporting
Billing & Contract Invoice System
Notification, Chat, Alarms Framework
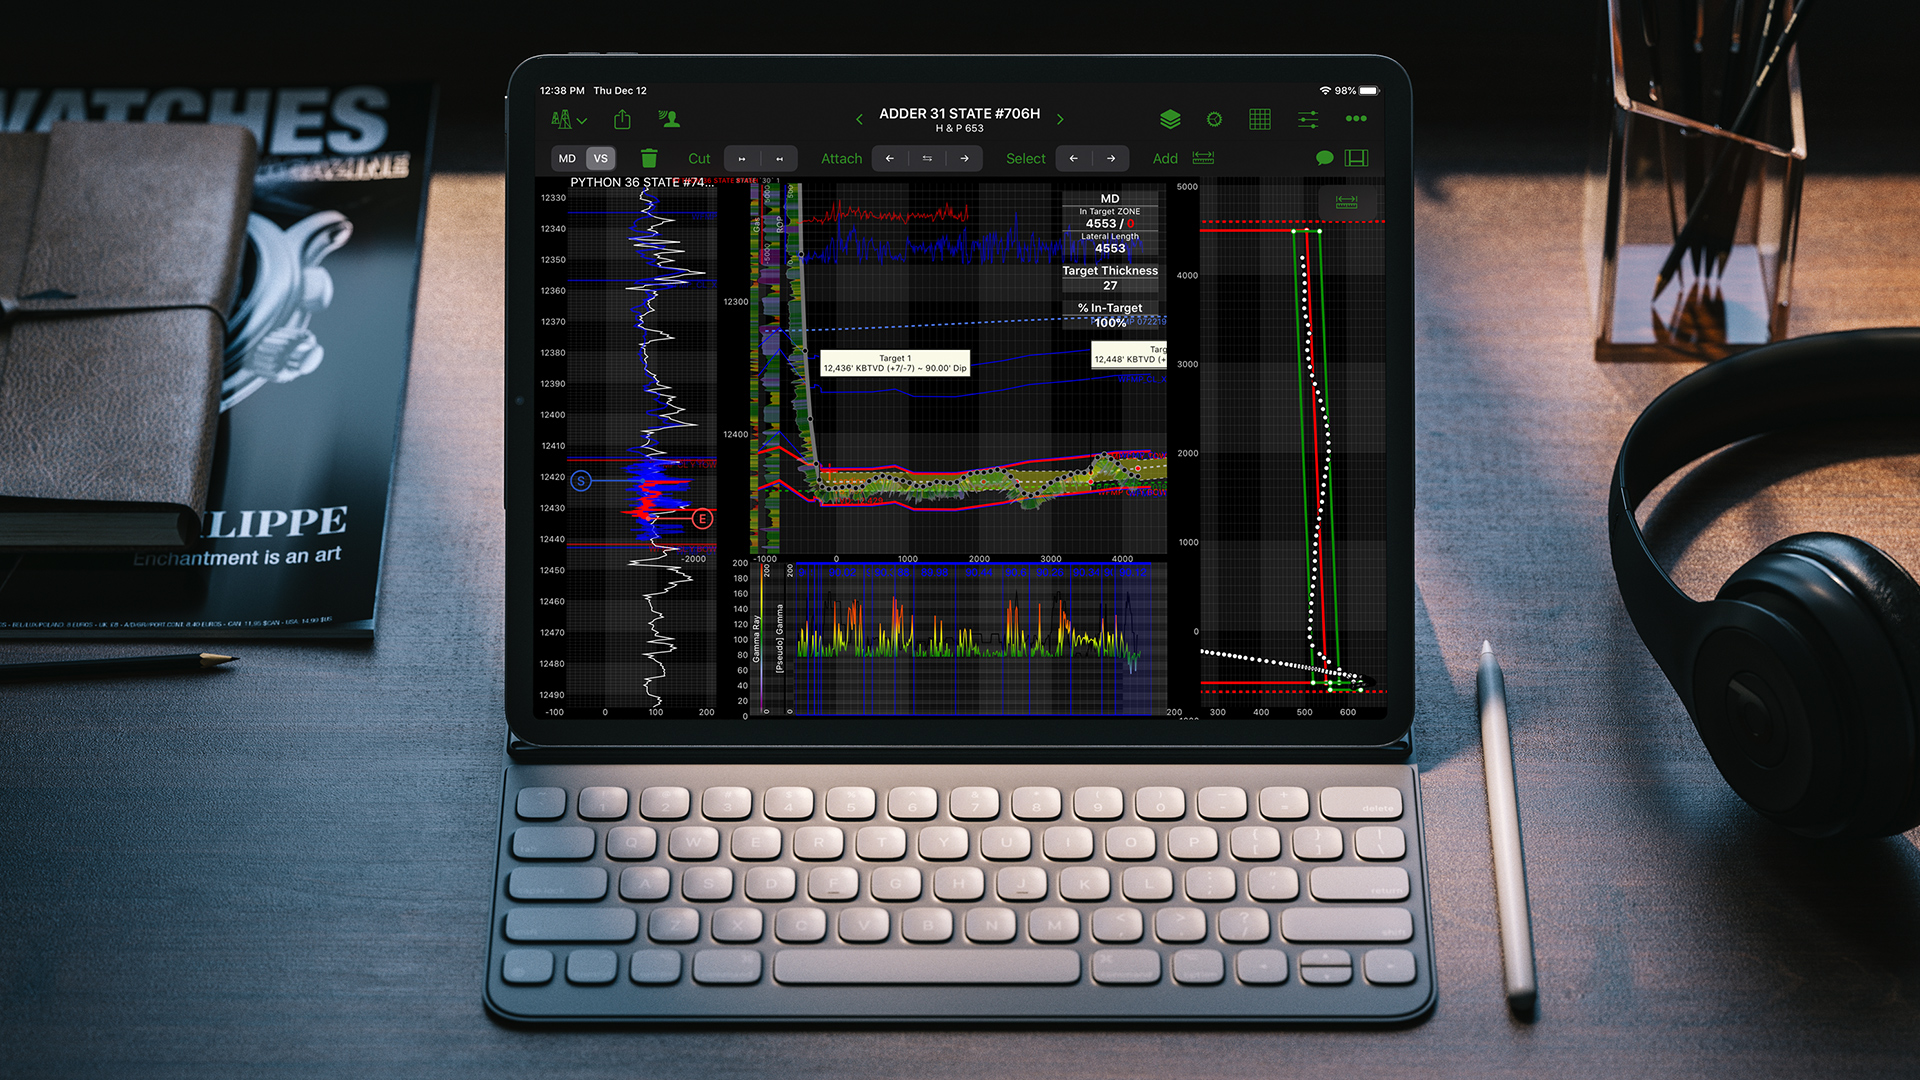
Engineering & Science
Live data map, land exploration and analysis
Chemical, Completion and Equipment
Safety Reporting Framework


NDA: I have omitted and obfuscated confidential information in this portfolio. Case studies password under request only.
C Leadership dashboard surfacing data across 5K+ wells with KPI, energy performance insight, demand management, and all-in-one reporting mechanism for Wall St. Surface critical and high value KPI metrics for strategy and analysis. Mobile impact is 900% utilization over desktop, multi-million ROI.


Co-built foundational frameworks and tools for seamless design to development, ensuring high standards of consistency in visual language and patterns cross-platforms for 7 years. 600+ components and patterns, design standards, themed light/dark modes, dynamic scaled typography and iconography.
- Evolution yearly from iOS 8 to iOS 14 Components
- Data visualization
- Data color sequencing & theme
- Dynamic custom SF Symbol Icons
- Content strategy: KPI cards, lists, and widgets
- Tooling for Cross-Platform token
- Over 600 Components in Library for Templates


50 financial analysts needed to align 5,000+ forecast plans to actuals by reducing variances but it's very manual and tedious. We reimaged a new interactive, mobile-first visualization interaction which increased 3x engagement and 1.5x completion rate and 2.4x speed.


Comprehensive real-time financial tool that compares across dynamic spectrum streams for commodities management, trend forecasting, and capital planning and analysis. This monitoring tool provides over 500 KPIs to track various metrics, with an annual ROI $1.1m, increased usage by 5.2x.

©—2025 Cat Lo. All Rights Reserved ↗ Privacy Policy