
Eldercheck
Using the Apple WatchOS1 to design for accessibility, heart monitoring with the integration of HealthKit & Location Tracking.
Geriatric Heart Monitoring App
Watch Series 1
AGENCY MartianCraft
YEAR 2015 - Current
ROLE Product UX/UI Designer
DEV Brian Harmann
INSIGHT
When Dr. Gregg, trauma surgeon and medical director of American College of Surgeons, was treating geriatric patients, he noticed an acute opportunity for smart technology.
Invested in the mission of marrying technology and treament of patients, Dr. Gregg wanted to create a simplified system for geriatric and caregivers. With the launch of Apple Watch 1 in 2015, and introduction of wearable tech, we were tasked to create a health app to bring peace of mind.
Smart Snap-To Algorithms
Increased Speed 240%
Completion Rate Increased
Increased by 150%
INSIGHT
Connect caregivers with heart rate data and well-being information from elders they care for.
Problem:
Forecasts are not being completed
Completion Accuracy and Speed is Abysmal
Hitting Company Bottom Line

Falls are the leading cause of fatal injury.
One in three Americans aged 65+ estimated to fall 1 or more times a year. Every 11 seconds, an older adult is treated in the emergency room for a fall; every 19 minutes, an older adult dies from a fall.
Falls carry a heavy quality of life impact. A growing number of older adults fear falling and, as a result, limit their activities and social engagements. This can result in further physical decline, depression, social isolation, and feelings of helplessness.

Pain Points
Windows Desktop Workflow
No alternate ways to perform the tasks.
Accuracy & Velocity
Workflow is cumbersome and nothing in place to help speed up the work results.
Not a Friendly Experience
Windows Program has an inconsistent user experience.
Users have no incentive to keep up with this task in a timely manner.

CHALLENGES
Natural Language Processing
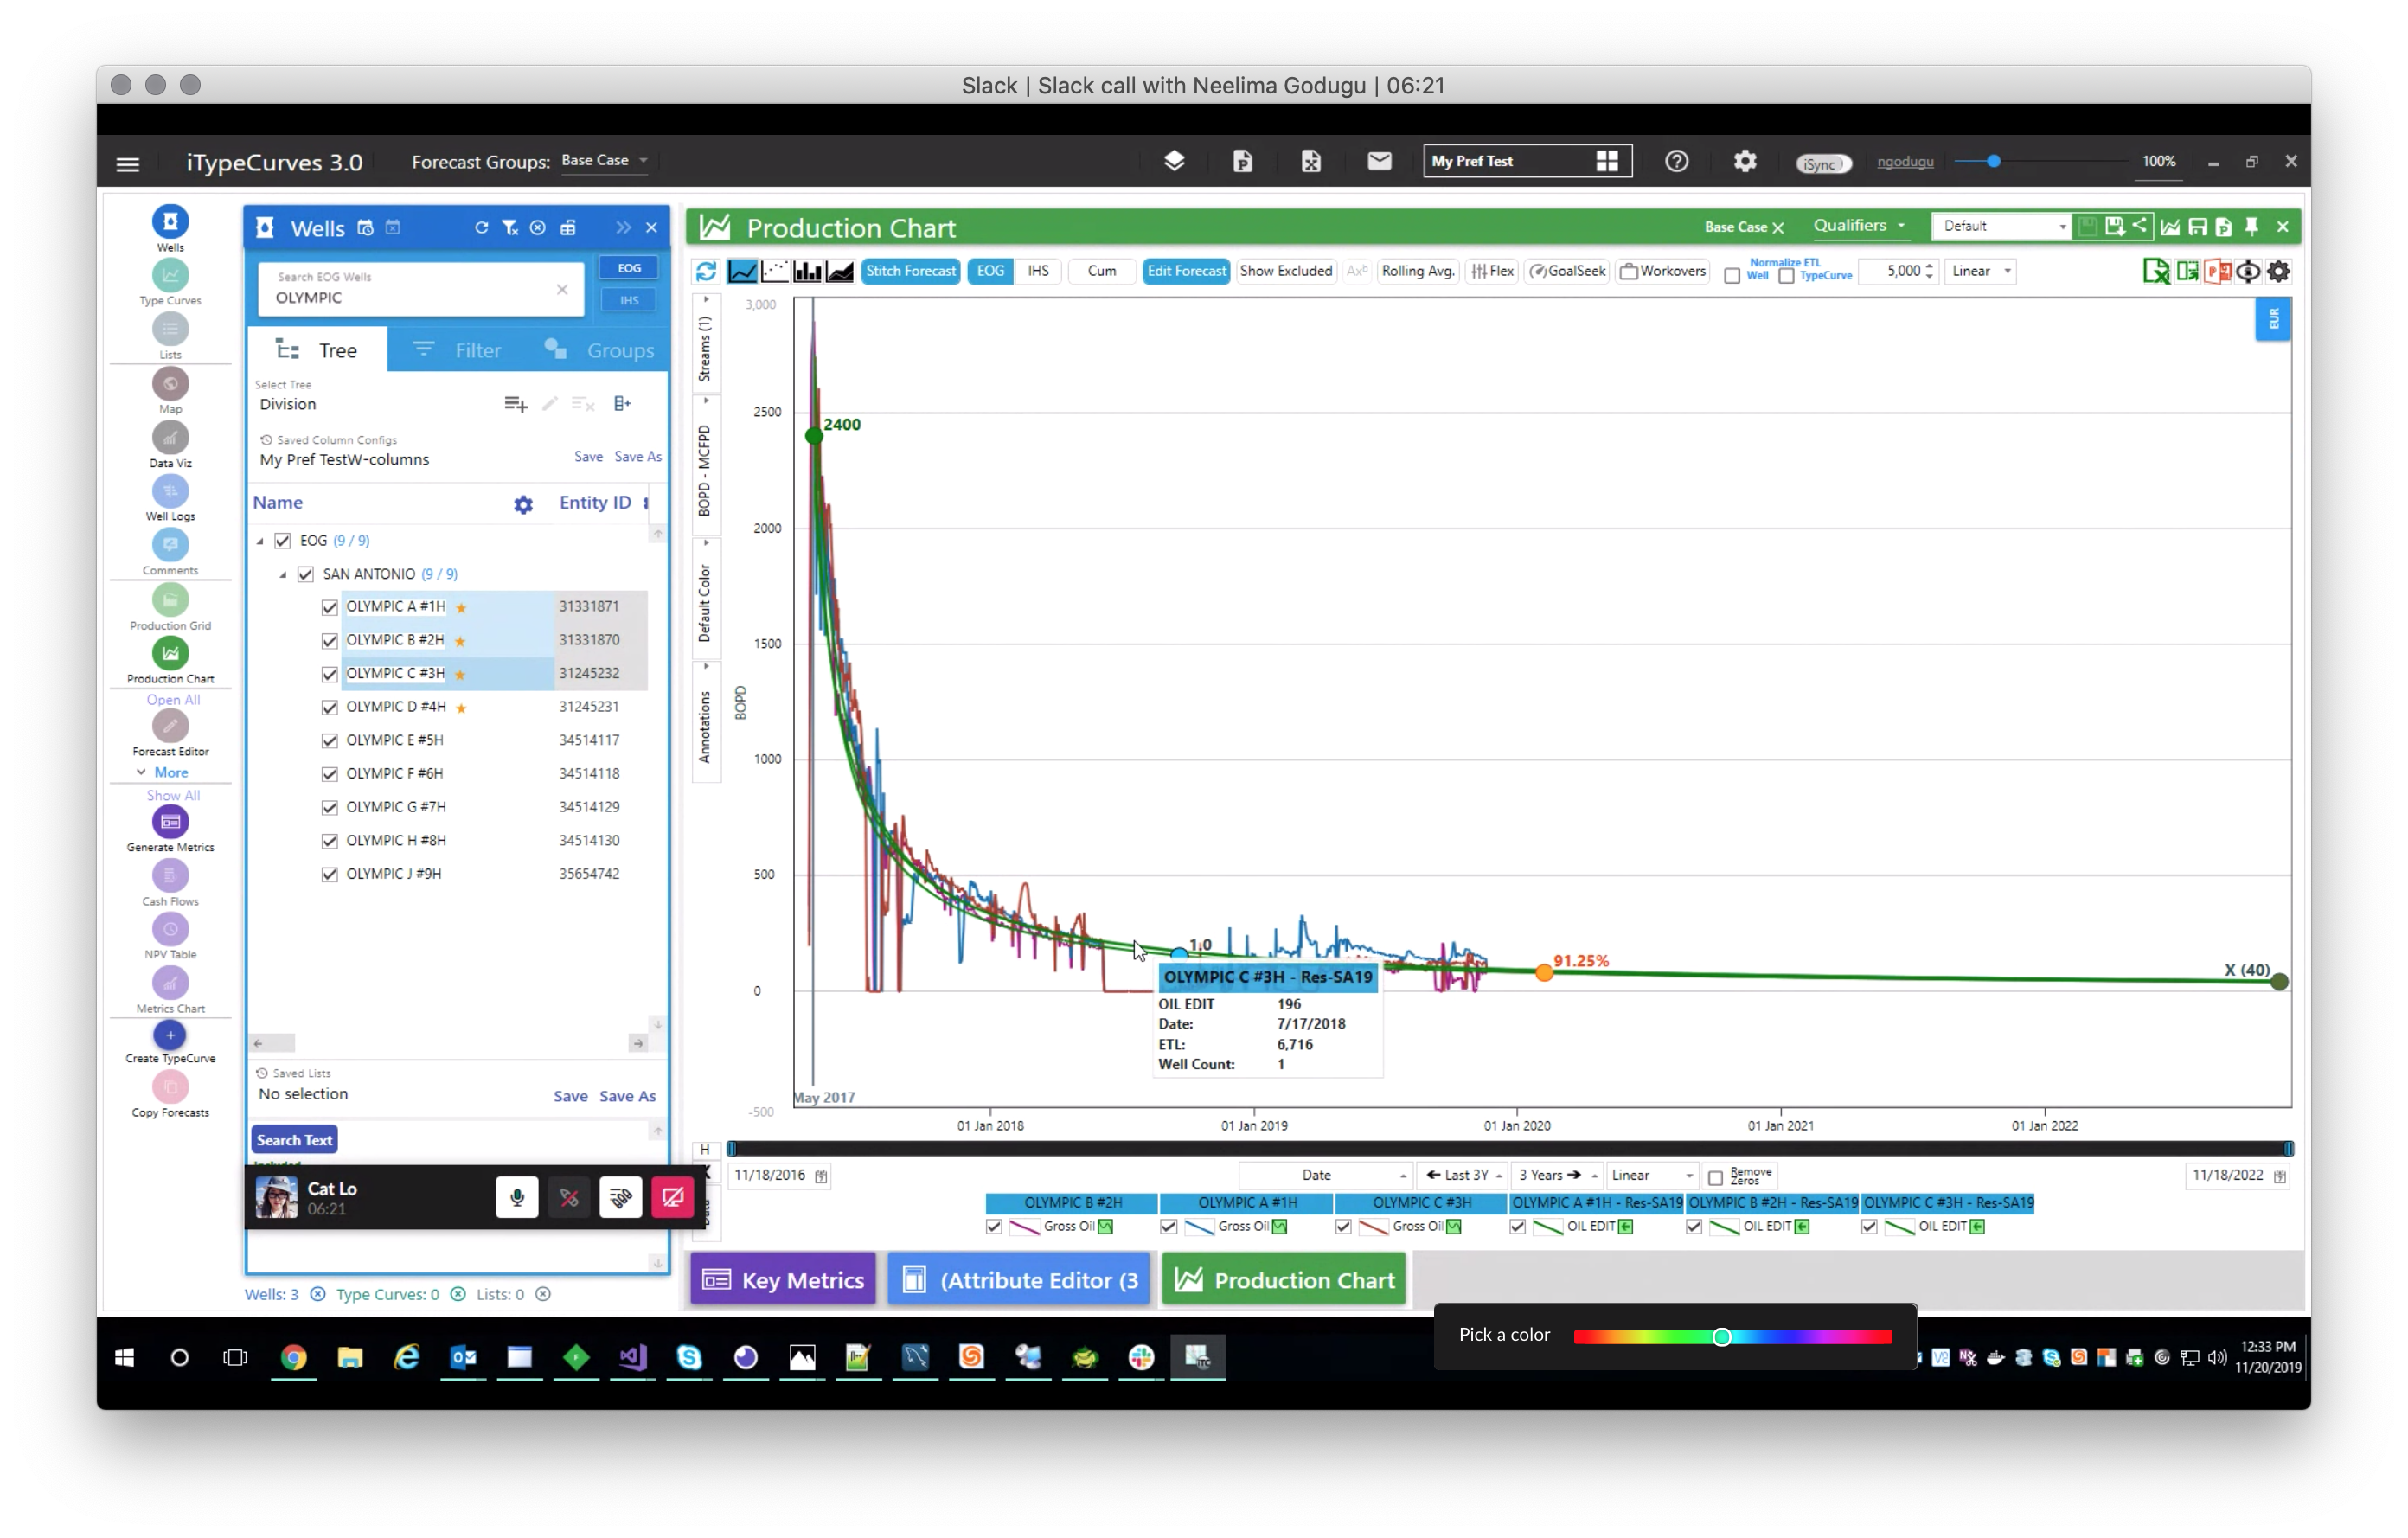
The initial portion of miTC is a Natural Language Processing sentence builder. The user is prompted with a list of attributions to narrow down entities. This dynamic, fluid approach allows users to build their list will enable us to approach a complex problem with delight.
This list filter UI is unlike any other, mainly because a number of variables and factors drive the contents of the list. With over 5,000 wells in the portfolio, this allows users to search through big data repositories to uncover relevant results.
Proof of Concept
Initial Prototype
This interface looks very simple, but in order to rehydrate each entity from any point of the sentence, it makes this a technical challenge. The goal of creating a sentence UI in this format is the aspiration of developing a workflow based on a number of different initializers and keywords that accurately filters the criteria in a smart way.

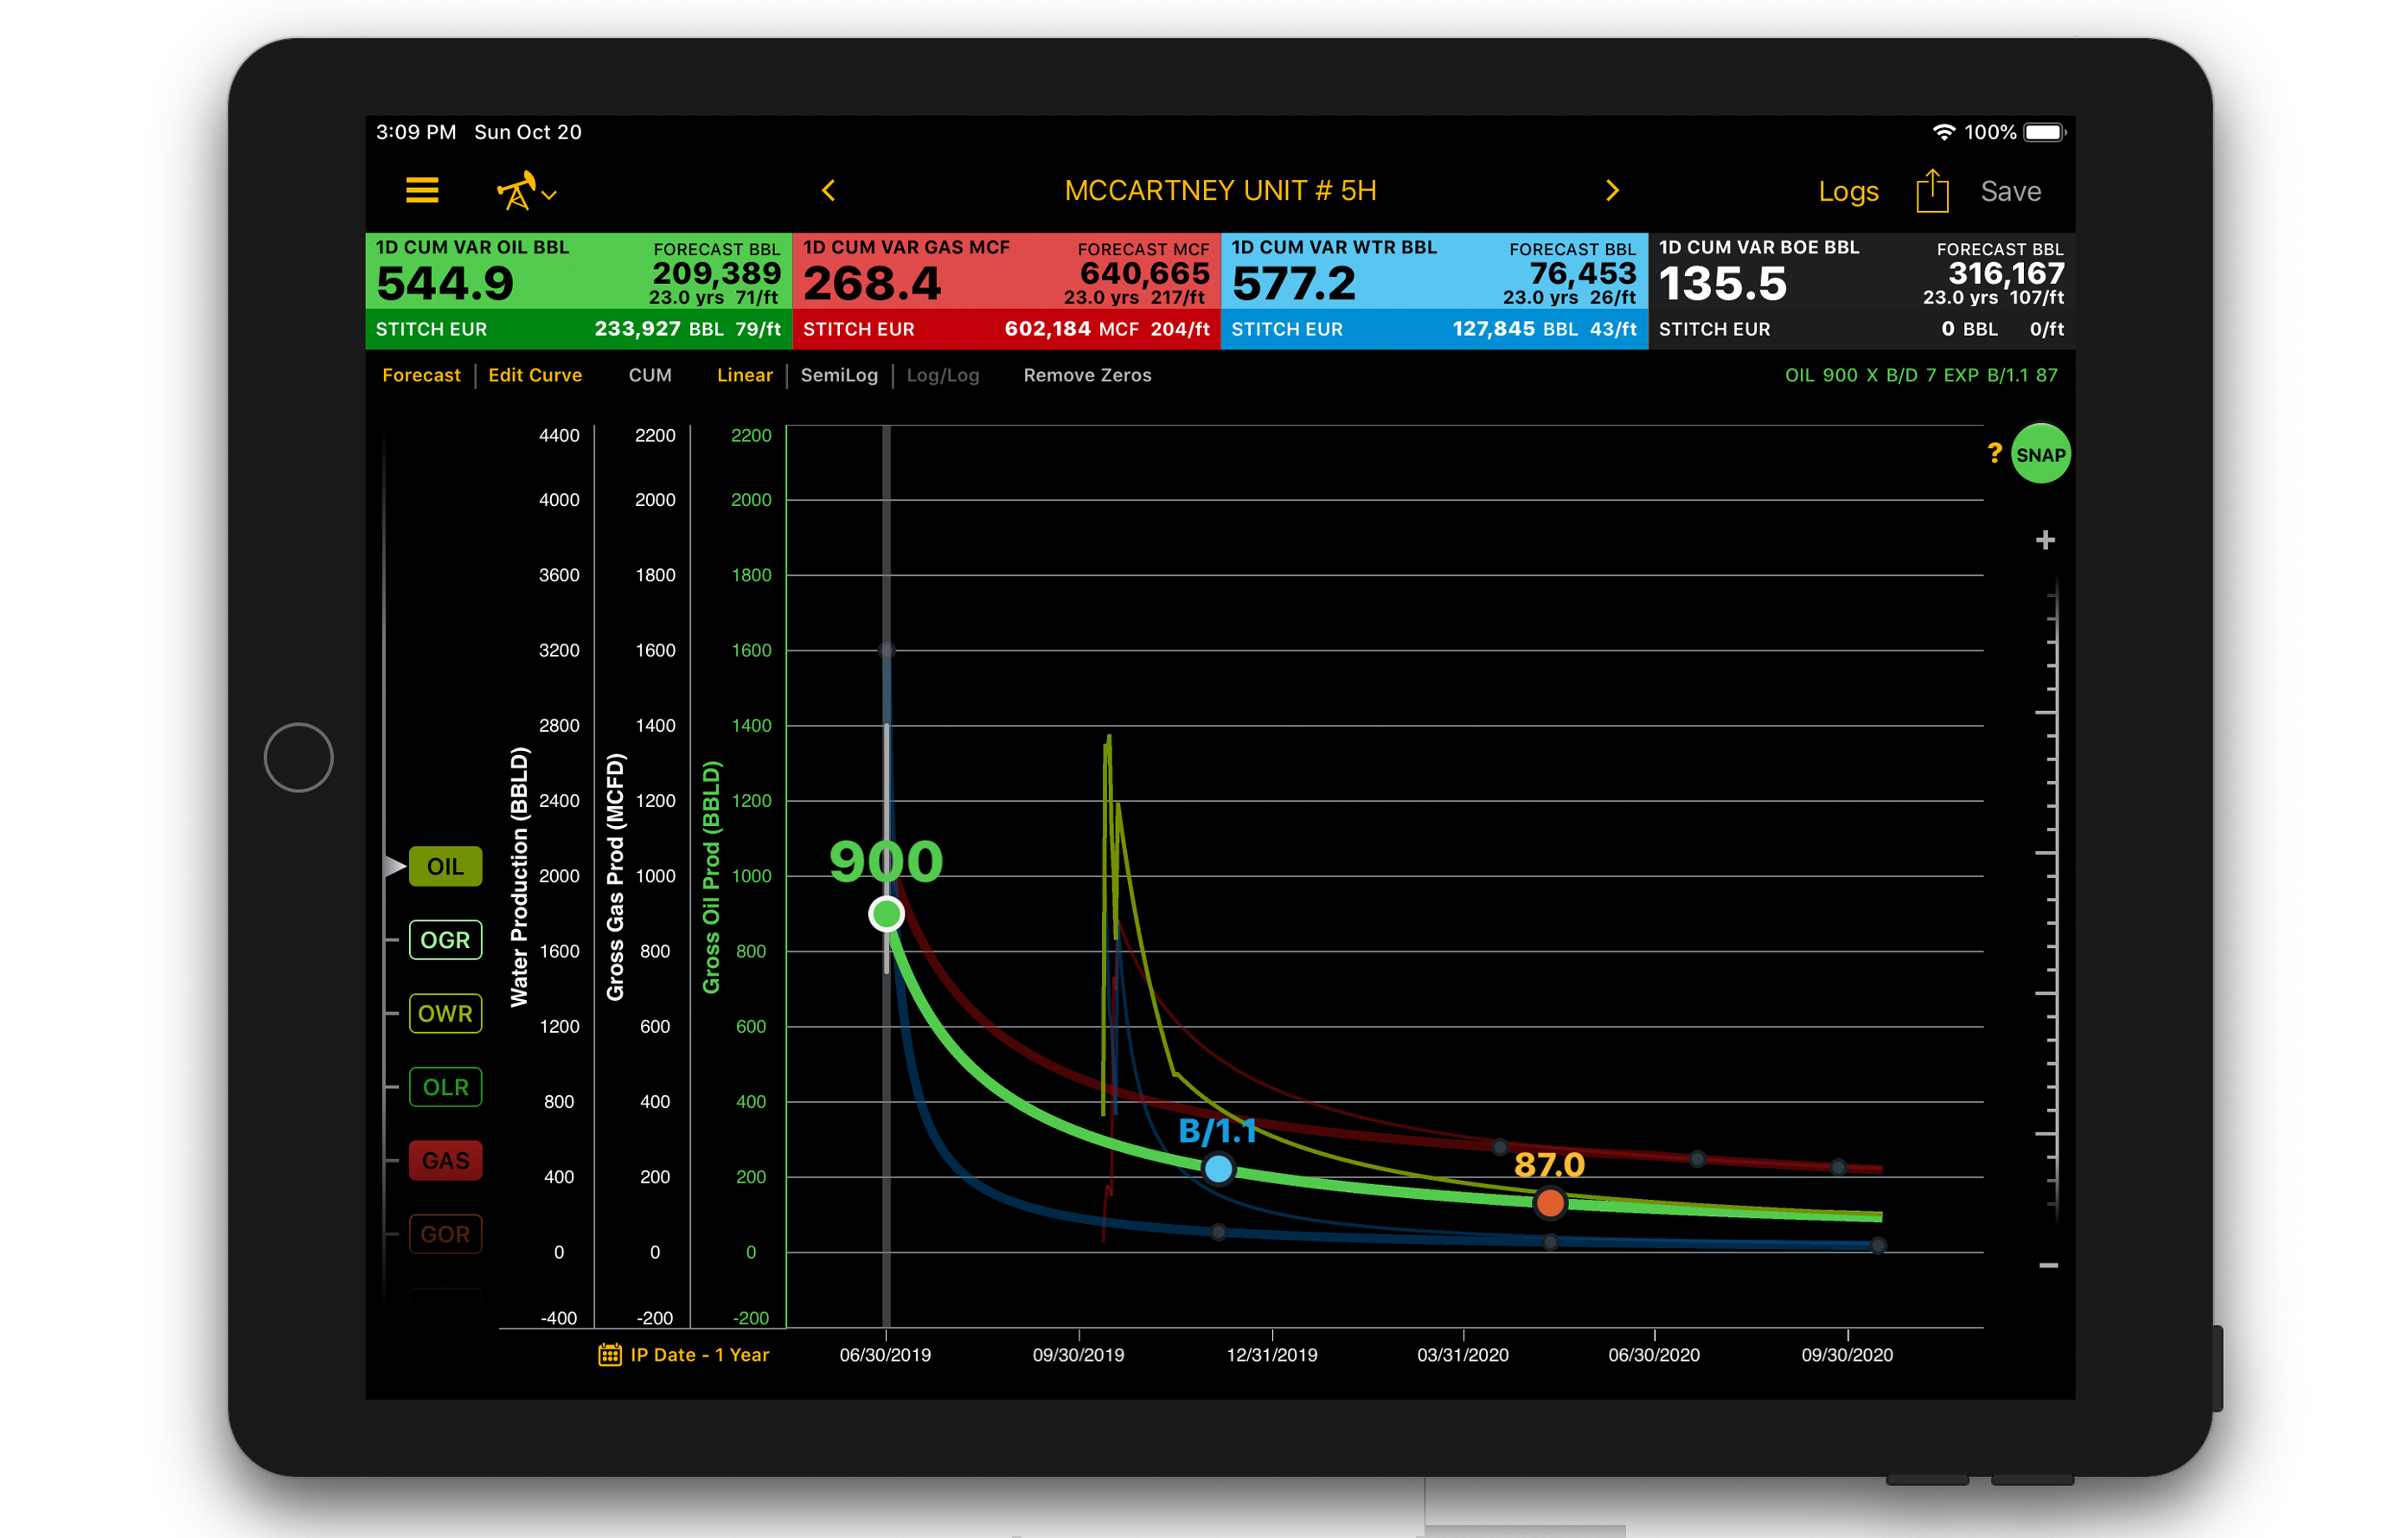
Curve Interaction
UX/UI Interaction animations were
prototyped for adjusting forecasts.
→ Segment Editor Prototype

Select a Value, dimming out the rest.

Adjust the value using right slider.

Left Buttons act as conditional Chart picker

Top Buttons act as Dashboard and Commodity Selector

Axis Consolidation as users can more than 60 streams+
Four major values determining forecast formula are:
- Initial Production Date - when did this well start producing
- B Factor - Oil Formation Volume Factor formula = ratio of vol of oil at reservoir temperature and pressure to the volume of oil at standard.
- Decline % = Well production declines over time as oil gets pumped out, there’s a percentage of how much it can produce, and what’s actually extracted.
- Linear - In a default scenario, most of the graph lines are plotted in a linear fashion.
Switching between Commodities
Traditional methods call upon using the Linear method of displaying the data, but an engineer can also check ratio/cumulative, linear/semiLog/Log/Log numbers to better edit the forecast.
The app allows users to select one of the 3 entities (oil/gas/water) - the three large buttons at the top of the screen. When one of the top buttons is selected, it displays secondary buttons on the lower left of the chart, in 4 variables. If Oil is selected from the top, a series of conditional charts appear as Oil/Gas Ratio, Oil/Water, and Oil/Liquids.
Manual editing of formulas, with dynamic conditional table cells
IMPACT BEFORE & AFTER
Polished, Accessible Designs Delighted Users
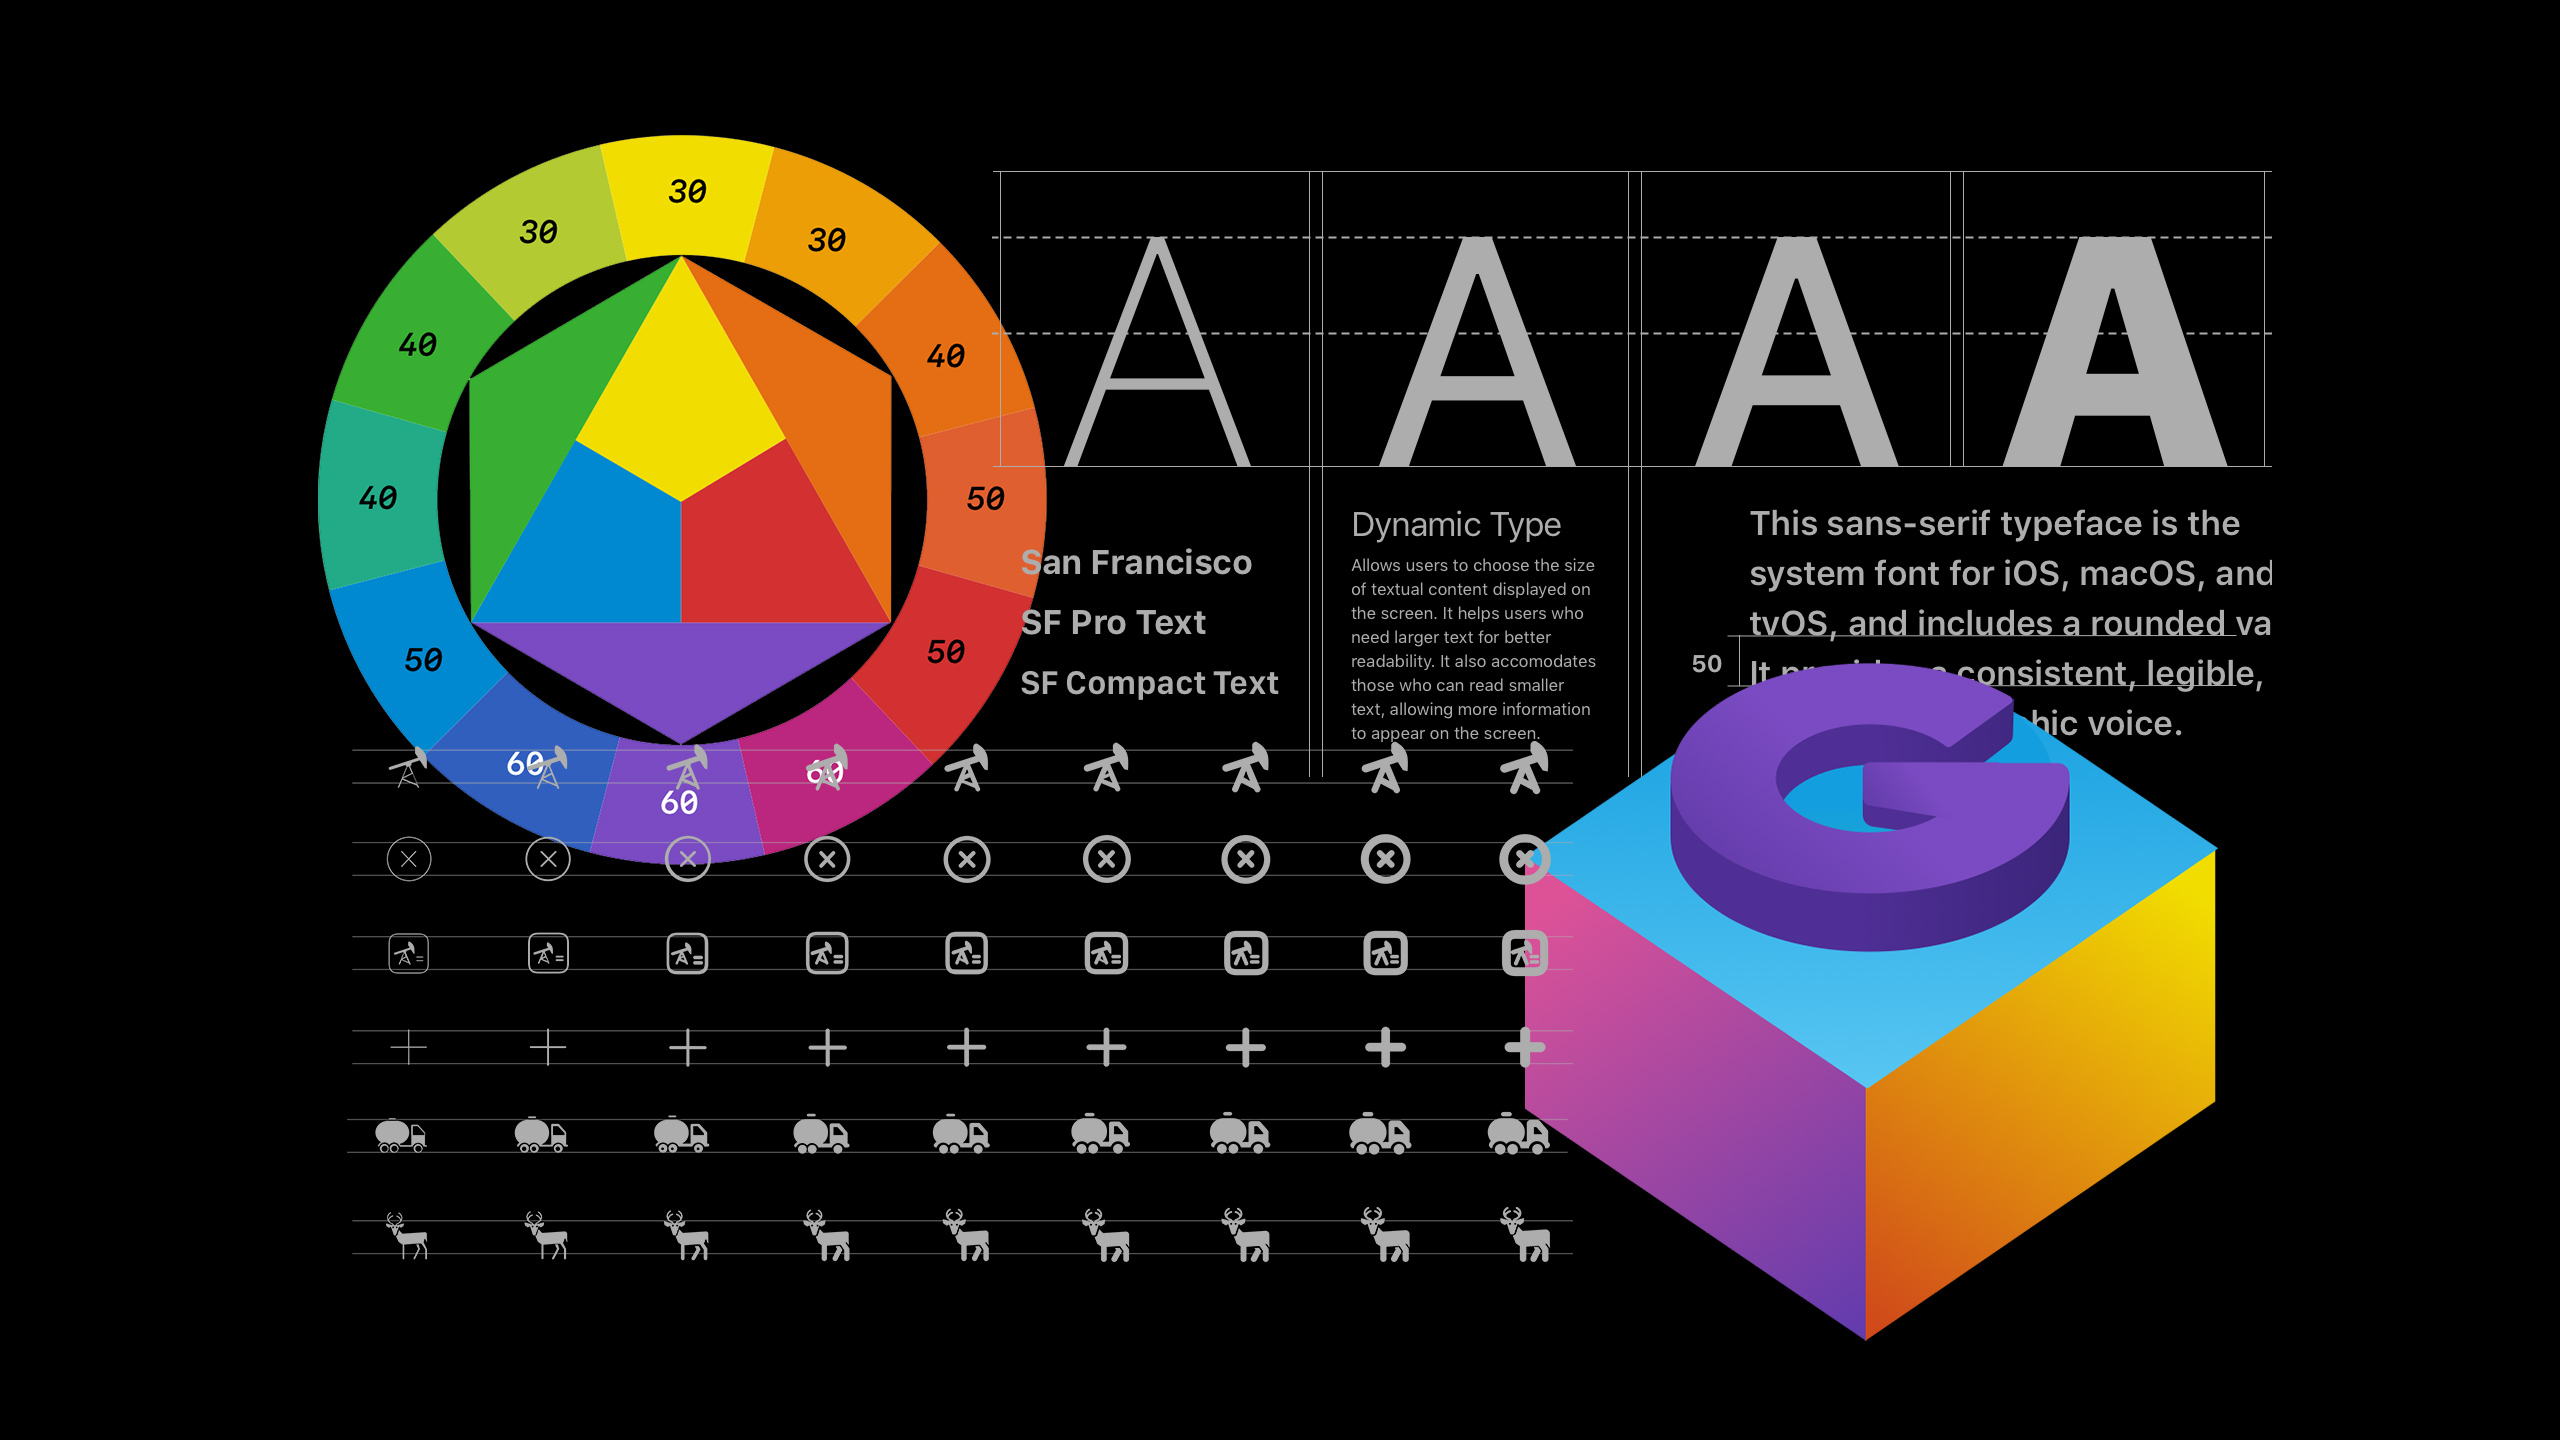
The rethinking of this application from its Windows Counterpart made a big impression with users. The colors and components designed in this application were derived from our new Design System. Fonts and Colors were tested for Accessibility.
Before (Windows Application), After (iPad)
Additional Prototypes
Search Workflow: To have interchangeable flexibility between adding wells manually or start a workflow with filter selection.
More Case Studies
©—2025 Cat Lo. All Rights Reserved ↗ Privacy Policy